Materials / Forest residues
Wood fibre insulation board, dry process
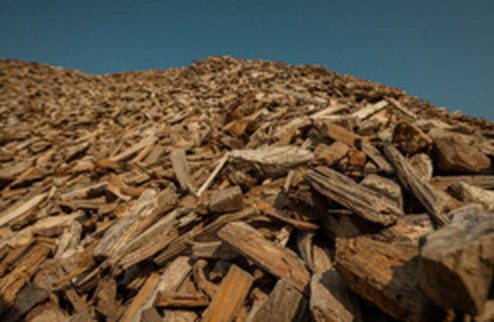
Logging residues (tops and branches) from softwood final fellings
Residues left at the landing are chipped and hauled to a fibreboard plant, defibrated, dried, mixed with PMDI and paraffin, and pressed into low-density boards.
Declared unit: 1 m³ of installed wood fibre insulation board, 153 kg/m3
Across the steps that could be counted, one declared unit releases about 5.4 kg CO2e of fossil greenhouse gases (range 4.5 to 8.8). The largest share comes from growing, harvesting and raw materials (A1, 70%). The material itself holds 269 kg of CO2 that the plants absorbed while growing. 3 of 12 burden flows have a number; the rest are marked as gaps below.
Every step, field to wall
Each tag is one process. Its colour shows the weakest evidence among its flows, and the number is its fossil CO2e in kg. Select a tag to open its rows in the inventory.
A1 Growing, harvesting and raw materials
Forest operations
Residue handling
- Seasoning on site
- Forwarding, chipping at landing and haul (48 km) 3.8
- Nutrient compensation (wood-ash recycling)
Field emissions
A2 Transport to the factory
Transport
A3 Making the product
Fibre plant
- S Sourced
- D Derived
- P Proxy
- A Assumption
- G Gap
- I Information
Where the fossil emissions happen
Bars add up counted flows only. The whiskers span the low and high cases from the ranges of amounts and emission factors.
The EPD reports 116.0 kg CO2e for A1-A3. Characterised flows explain 4.0 (3%). The remaining 112.0 is attributed to flows listed as gaps (mainly A3 energy and adhesives). It is indicative, not measured.
Checks and stored carbon
- Comparison with a published EPD
- STEICO dry-process EPD NEPD-10885-10885-2, GWP A1-A3: 116.0 kg CO2e/m3
Feedstock is mainly sawmill/thinning softwood, not residues. STEICO dry-process EPDs - Carbon stored in the material
- 146.9 kg dry mass x 0.50 C x 44/12 = 269.3 kg CO2 removed in A1 (reported separately).
Wood share 96% of 153 kg treated as dry mass. EN 16449:2014; TimberHP TimberBoard EPD - EPD range across densities
- 105 (140 kg/m3) to 135 (180 kg/m3) kg CO2e/m3 A1-A3 STEICO dry-process EPDs
Assumptions and key inputs
Change these per project by editing the data package. Values marked Assumption are the first ones to replace with real data.
| Parameter | Value | Status | DQ | Source | Note |
|---|---|---|---|---|---|
| Board density | 153 kg/m3 | S | 2 | STEICO dry-process EPDs | STEICO dry-process EPD reference density. |
| Fossil share (binder + additives) | 0.04 mass fraction | P | 3 | TimberHP TimberBoard EPD | From a dry-process wood fibre EPD (TimberBoard). |
| Allocation of forest operations | Harvest burdens allocated to stemwood; residues burden-free at the landing | A | 3 | EN 16485:2014 | Methodological choice; see sensitivity in the gap register. |
| Conversion: bone-dry tonnes residue per DU | 0.14688 | D | = 0.96 x 153 kg |
Inventory
One row per flow. "Per DU" converts the amount to one declared unit; kg CO2e = per DU x emission factor.
| Flow | Amount | Basis | Per DU | Emission factor | kg CO2e | Status | DQ | Source | Note |
|---|---|---|---|---|---|---|---|---|---|
| A1 Forest operations / Stemwood harvest (residues generated) Felling and processing produce tops and branches at the landing. | |||||||||
| Harvest burden allocated to residues | 0 L | per DU | 0 | Diesel, non-road (GNR), combustion + upstream 3.16 kg CO2e/L |
0.000 | Assumption | 3 | EN 16485:2014 | Allocation choice: burdens stay with stemwood. |
| A1 Residue handling / Seasoning on site Residues left 3-12 months to dry and drop needles (nutrient retention). | |||||||||
| No energy input | 0 - | per DU | 0 | no open factor | – | Information | 3 | – | |
| A1 Residue handling / Forwarding, chipping at landing and haul (48 km) 3.76 kg CO2e Combined value for recovery, chipping and haul. | |||||||||
| Diesel, forwarding + chipper + haul | 8.1 L 8.1–12 |
per bdt | 1.18973 | Diesel, non-road (GNR), combustion + upstream 3.16 kg CO2e/L |
3.760 | Sourced | 3 | Forest Products Journal 62(4); Rozanski & Jablonski 2010 | Includes 48 km haul (part of A2). |
| A1 Residue handling / Nutrient compensation (wood-ash recycling) Optional return of ash to compensate nutrient export. | |||||||||
| Ash spreading | ? - | per DU | – | no open factor | – | Gap | 5 | – | |
| A1 Field emissions / Soil carbon effect of residue removal | |||||||||
| SOC change | ? kg CO2 | per DU | – | no open factor | – | Gap | 5 | – | Report under GWP-luluc when quantified. |
| A2 Transport / Additional haul to board plant Haul beyond the 48 km already in res-03. | |||||||||
| Truck transport | 0 t.km | per DU | 0 | Road freight, articulated truck 34-40 t 0.0875 kg CO2e/t.km |
0.000 | Assumption | 4 | Truck 34-40 t default | Set > 0 for plants further than 48 km. |
| A2 Transport / PMDI and paraffin to the fibre plant 0.27 kg CO2e Inbound road freight of fossil additives. | |||||||||
| Truck transport | 3.06 t.km 1.224–6.12 |
per DU | 3.06 | Road freight, articulated truck 34-40 t 0.0875 kg CO2e/t.km |
0.268 | Assumption | 4 | Truck 34-40 t default | = 6.12 kg x 500 km (assumed supplier distance). |
| A3 Fibre plant / Chip screening and washing Removal of stones and fines. | |||||||||
| Electricity | ? kWh | per DU | – | Electricity, France average consumption mix 2024 0.058 kg CO2e/kWh |
– | Gap | 5 | – | |
| A3 Fibre plant / Thermo-mechanical defibration (refiner) | |||||||||
| Electricity | ? kWh | per DU | – | Electricity, France average consumption mix 2024 0.058 kg CO2e/kWh |
– | Gap | 5 | – | |
| A3 Fibre plant / Fibre drying (flash tube dryer) | |||||||||
| Heat | ? MJ | per DU | – | no open factor | – | Gap | 5 | – | |
| A3 Fibre plant / Binder and additive dosing PMDI and paraffin emulsion. | |||||||||
| PMDI + paraffin | 6.12 kg | per DU | 6.12 | no open factor | – | Proxy | 3 | TimberHP TimberBoard EPD | = 4% of 153 kg; EF not available. |
| A3 Fibre plant / Mat forming, steam-air preheating and pressing | |||||||||
| Electricity + steam | ? kWh | per DU | – | Electricity, France average consumption mix 2024 0.058 kg CO2e/kWh |
– | Gap | 5 | – | |
| A3 Fibre plant / Cutting, profiling, packaging | |||||||||
| Electricity + packaging | ? - | per DU | – | no open factor | – | Gap | 5 | – | |
| A4 Transport / Delivery to site 1.34 kg CO2e | |||||||||
| Truck transport | 15.3 t.km 7.65–30.6 |
per DU | 15.3 | Road freight, articulated truck 34-40 t 0.0875 kg CO2e/t.km |
1.339 | Assumption | 4 | Truck 34-40 t default | = 0.153 t x 100 km. |
| A5 Installation / Cutting and fixing between studs / on sheathing | |||||||||
| Fasteners, offcuts | ? - | per DU | – | no open factor | – | Gap | 5 | – | |
| Total fossil CO2e, counted flows | 5.37 | range 4.46 to 8.78 | |||||||
| EPD-calibrated residual (A1-A3, indicative) | 111.97 | total with residual 117.34 | |||||||
Not included
- Manufacture of machinery, vehicles, factory buildings and forest roads (capital goods)
- Staff commuting, offices and research
- Use stage (B1-B7) and end of life (C1-C4, D); lime carbonation during use is shown as information only
- Land-use change and soil carbon, listed as gaps where relevant because they are site-specific
Sources used on this page
- STEICO dry-process EPDs. STEICO SE, EPD Norge NEPD-10885-10885-2 (153 kg/m3: 116 kg CO2e/m3 A1-A3); NEPD-11325 (140 kg/m3: 105); NEPD-11334 (180 kg/m3: 135). Link
- TimberHP TimberBoard EPD. TimberHP TimberBoard EPD (EPD Hub): 96% bio-based, 4% fossil materials by mass. Link
- Forest Products Journal 62(4). Forest residue recovery: 8.10 L/BDmT at 48 km haul (recovery from landing), Forest Products Journal 62(4):258. Link
- Rozanski & Jablonski 2010. Rozanski H., Jablonski K. (2010). Energy consumption in logging residue chips and bundles production (~196 MJ/m3 woody fuel). Acta Sci Pol Silv. Link
- ADEME Base Empreinte (fuels). ADEME Base Empreinte, status 'valide generique': gazole non routier 3.16 kgCO2e/L; gazole routier B7 3.10 kgCO2e/L; electricite 2022 0.05 kgCO2e/kWh (combustion + upstream). Link
- ADEME Base Empreinte (electricity 2024). ADEME Base Empreinte, electricite mix moyen France 2024 = 58 gCO2e/kWh (as used by SNCF comparateur carbone). Link
- Truck 34-40 t default. Regulatory default 2026 for articulated truck 34-40 t: 0.0875 kgCO2e per t.km (as reported by Projet Celsius, from ADEME Base Empreinte). Link
- EN 16449:2014. EN 16449:2014 Wood and wood-based products: calculation of biogenic carbon content (carbon fraction 0.5 of oven-dry mass). Link
- EN 16485:2014. EN 16485:2014 Round and sawn timber: PCR for wood and wood-based products (allocation, biogenic carbon). Link